The critical decision for your Canadian supply chain is not choosing Peel Region *or* Calgary; it’s architecting a strategic network that leverages the unique strengths of *both*.
- Peel Region offers unparalleled market density and access to Eastern Canada but comes with significant cost pressures from labor competition and real estate.
- Calgary provides a cost-effective, low-friction gateway to Western Canada, with superior intermodal terminal access and a less saturated labor market.
Recommendation: Shift from a single-node mindset to a dual-hub architecture. Model your total cost-to-serve across this network to optimize for both national service levels and bottom-line performance.
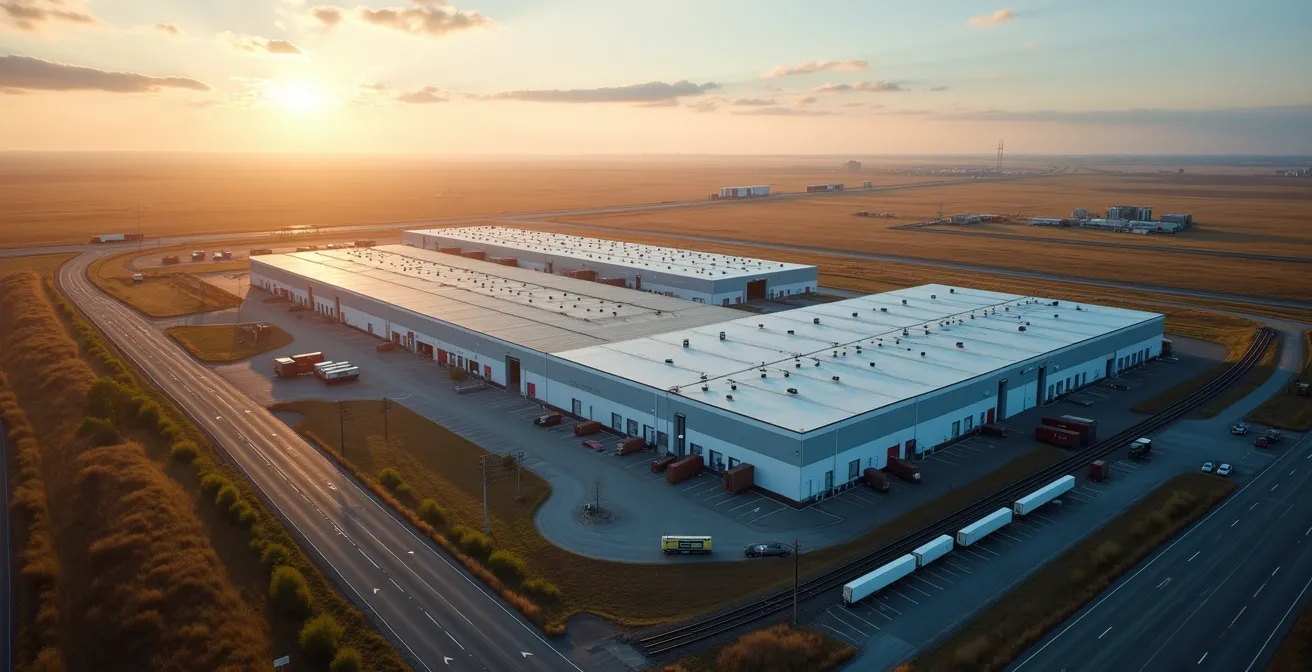
For any supply chain director overseeing Canadian operations, the Peel Region versus Calgary debate is a perennial strategic exercise. The Greater Toronto Area, with Peel at its core, is undeniably the country’s logistics heartland, boasting the highest population density and a vast consumer market. However, positioning a distribution center solely based on this fact overlooks the complex and costly realities of serving a nation as geographically vast as Canada. The rising prominence of Calgary as a strategic inland port and Western Canadian gateway forces a more nuanced evaluation.
Conventional wisdom focuses on a simple trade-off: market access versus geographic reach. This analysis often leads to a static, binary choice. But this framework is increasingly obsolete in the face of modern e-commerce demands and escalating operational costs. The fundamental flaw is in treating this as an ‘either/or’ problem. An advanced logistical strategy no longer seeks a single ‘best’ location but rather an optimized network of facilities.
This article reframes the decision. We will argue that for national-scale operators, the optimal solution lies in a dual-hub architecture. The real question is not *which* hub to choose, but how to configure a complementary system where Peel and Calgary each perform a specialized role. This approach transforms the decision from a real estate choice into a network design problem, focused on minimizing total cost-to-serve while maximizing service-level agreements across the country.
To build this strategic framework, we will dissect the critical variables that must inform your site selection model. From the granular impact of intermodal drayage costs to the macro dynamics of labor availability and multi-modal integration, this guide provides the analytical tools to move beyond a simple map pin and toward a truly optimized Canadian distribution network.
Summary: A Site Selection Framework for Your Canadian DC Network
- Why Distance from Intermodal Terminals Impacts Your Bottom Line by 15%?
- How to Assess Warehouse Staff Availability in Rural Hubs?
- Class A vs. Class B Facilities: Which Offers Better ROI for E-commerce Fulfillment?
- The Location Mistake That Adds 2 Hours to Every Outbound Shipment
- How to Use Geographic Information Systems (GIS) to Map 1-Day Delivery Zones?
- Downtown Montreal vs. Laval: Which Location Suits a Logistics Heavy Business?
- How to Staff Your Warehouse for the Holiday Rush vs. the January Slump?
- Multi-Modal Transportation in Canada: How to Reduce Shipping Costs by 20%?
Why Distance from Intermodal Terminals Impacts Your Bottom Line by 15%?
The first and often most underestimated factor in a site selection model is the cost of drayage—the transport of freight from an ocean port or intermodal terminal to a distribution center. While lease rates per square foot are a visible line item, inefficient drayage silently erodes margins on every container. A strategically located facility can drive a 15% reduction in warehousing costs primarily by minimizing these first-mile movements. This is not just about fuel and driver time; it’s about terminal congestion, appointment availability, and chassis utilization.
In the Peel Region, proximity to the massive CN and CP yards in Vaughan and Brampton is a key advantage, but this comes with a significant trade-off: extreme congestion. Peak-time delays can add 2-3 hours to a simple dray, and mandatory, hard-to-get appointments create operational fragility. Calgary’s intermodal hubs, while handling less volume, offer greater flexibility and significantly lower friction. Shorter average drayage distances and moderate congestion levels translate into more predictable, lower-cost inbound operations.
This comparative analysis of terminal proximity and efficiency is fundamental to your cost-to-serve model. What you might save on outbound shipping to the dense GTA market could be completely negated by inflated inbound drayage costs and demurrage fees caused by terminal bottlenecks.
| Factor | Peel Region (GTA) | Calgary |
|---|---|---|
| Major CN/CP Terminals | Vaughan/Brampton | Calgary Logistics Park/Shepard |
| Average Drayage Distance | 15-25 km | 10-20 km |
| Gate Congestion Level | High (peak delays 2-3 hrs) | Moderate (peak delays 30-60 min) |
| Terminal Appointment Availability | Mandatory, limited slots | Flexible, more availability |
How to Assess Warehouse Staff Availability in Rural Hubs?
Beyond the physical infrastructure, the availability and cost of qualified labor is the single largest operating expense and risk factor for a distribution center. In hyper-competitive markets like the GTA, the rapid growth of e-commerce and a flurry of M&A activity have led to significant wage inflation and retention challenges. Assessing labor is no longer about simply checking unemployment rates; it requires a granular analysis of labor pool density, competition, and the required skill sets for modern logistics.
The challenge is particularly acute as warehouses evolve into sophisticated fulfillment centers. The need for talent skilled in operating Industry 4.0 technologies—from warehouse management systems (WMS) to automated picking solutions—creates a demand for a new class of employee. These specialized talent pools are often concentrated in major urban centers, but this is also where competition is fiercest.
Case Study: Labor Competition in Major Canadian Hubs
A recent analysis by BDO Canada of the logistics sector highlights a critical trend: intense competition for both general and skilled labor in hubs like the GTA is forcing companies to entirely rethink their business models. The report emphasizes that workforce planning, including proximity to technical colleges and the ability to attract talent from competing firms, has become as critical as transportation access in site selection decisions. Companies are finding that locating in slightly less saturated, adjacent markets can provide a more stable and cost-effective workforce, even if it means slightly longer outbound delivery routes.

As this visualization suggests, the labor landscape is not uniform. Calgary and its surrounding areas, while smaller, represent a less saturated market compared to the intense clustering of facilities in Peel. This can translate to lower staff turnover and more predictable wage growth, a crucial variable for long-term operational stability. Your analysis must therefore map not just population, but the precise location of competitor DCs, post-secondary institutions, and public transit routes that influence the true accessibility of the labor pool.
Class A vs. Class B Facilities: Which Offers Better ROI for E-commerce Fulfillment?
The choice between a modern Class A facility and an older Class B building is not a simple rent comparison; it’s a strategic decision about your company’s future operational model. For e-commerce fulfillment, which relies heavily on speed, accuracy, and automation, the specifications of a Class A building often provide a far superior long-term Return on Investment (ROI), despite higher upfront costs. These facilities are built with modern logistics in mind.
Key features like minimum 32-foot clear heights, high floor-flatness ratings (FF50/FL25), and robust power capacity (400+ amps) are not just nice-to-haves; they are prerequisites for implementing the kind of automation and high-density racking that drives efficiency. Trying to retrofit a Class B facility can be prohibitively expensive and may never achieve the same operational velocity. Furthermore, the advantages extend to risk management and brand image. Modern fire suppression systems in Class A buildings are a major factor, as Class A facilities typically achieve 20-30% lower insurance premiums. Additionally, LEED-certified buildings can unlock access to green financing and bolster your corporate ESG (Environmental, Social, and Governance) profile.
Calculating the true ROI requires looking beyond the lease rate to the Total Cost of Occupancy. This includes factors like energy efficiency, insurance savings, and, most importantly, the potential for labor cost reduction through automation. A Class A facility is an investment in future productivity.
Action Plan: Auditing ROI for Class A vs. Class B Facilities
- Calculate Total Cost of Occupancy, including projected energy usage and ESG compliance costs for LEED-certified buildings.
- Assess automation-readiness specifications: verify minimum 32ft clear heights, floor flatness (FF50/FL25), and 400+ amps power capacity.
- Compare binding insurance premium quotes between target Class A (modern fire suppression) and Class B facilities.
- Model long-term labor cost reduction enabled by the automation and high-density storage potential in Class A spaces.
- Factor in the value of green financing availability and the brand image benefits associated with sustainable, modern facilities.
The Location Mistake That Adds 2 Hours to Every Outbound Shipment
The most common and costly site selection error is mistaking geographic proximity for actual accessibility. A distribution center located just a few kilometers from a major highway can look perfect on a map, but if that route is plagued by daily, predictable gridlock, you’ve built a permanent bottleneck into your supply chain. This is a particularly acute problem in the Peel Region, where the concentration of industrial traffic on highways like the 401 and 410 can add hours to transit times, jeopardizing delivery windows and inflating fuel and labor costs.

The financial impact of these delays is staggering. An extra two hours per outbound run, multiplied across a fleet of trucks over a year, represents a massive and entirely avoidable operational expense. It directly impacts your ability to meet customer service-level agreements (SLAs) and adds immense stress to your drivers and dispatch teams. This is why a sophisticated site analysis must go beyond static maps and incorporate dynamic data, including real-world traffic patterns, planned infrastructure projects, and the availability of alternate routes.
This reality underscores the need for a more distributed network, a point highlighted by logistics experts. As PITT OHIO Logistics notes in their comprehensive guide:
Canada’s immense size necessitates a decentralized warehousing strategy. Ideally, warehouses should be strategically positioned near major population centers and transportation hubs, enabling faster delivery times and reduced costs.
– PITT OHIO Logistics, Canadian Warehousing and Distribution Guide
Placing a hub in a location like Calgary, which serves the Western market through less congested corridors, is a direct application of this principle. It acts as a pressure-release valve for the entire network, preventing the operational and financial drag caused by the bottlenecks inherent in a single, hyper-concentrated hub.
How to Use Geographic Information Systems (GIS) to Map 1-Day Delivery Zones?
In today’s e-commerce landscape, delivery speed is a competitive weapon. The ability to promise and reliably execute 1-day or 2-day delivery is often the deciding factor for a consumer. Geographic Information Systems (GIS) are the essential tool for transforming this market expectation into a logistical reality. GIS software allows supply chain directors to move beyond simple mileage calculations and model true service zones based on a multitude of real-world variables.
Instead of drawing circles on a map, a GIS model layers data to create a highly accurate picture of your delivery capabilities from a potential DC. This includes:
- Road Network Data: Incorporating actual speed limits, one-way streets, and turn restrictions.
- Historical Traffic Data: Modeling how congestion patterns change by time of day and day of week.
- Carrier Cut-off Times: Factoring in the latest possible time a package can leave the DC to make it into the carrier’s network for next-day delivery.
- Population Density: Overlaying census data to visualize the number of households you can reach within your defined service zones.
By running these models for both a Peel Region and a Calgary location, you can visually and quantitatively compare their respective strengths. A Peel DC will show immense density within a 1-day zone, covering a huge portion of Canada’s population. A Calgary DC will demonstrate vast geographic reach across the four western provinces, a region that is prohibitively slow and expensive to serve from the GTA alone.
Case Study: Farrow’s Dual-Hub Strategy for National Coverage
The effectiveness of this GIS-driven, dual-hub approach is demonstrated by Farrow’s national distribution strategy. By operating facilities in both the Toronto area and Vancouver, they have strategically engineered a network that provides 2-day shipping coverage to the vast majority of the Canadian population. Their GTA hub gives them immediate access to Eastern markets and critical US border crossings, while the Vancouver location efficiently serves Western Canada. This model, planned with precise geographic analysis, optimizes national reach while minimizing the high transportation costs of cross-country shipping.
Downtown Montreal vs. Laval: Which Location Suits a Logistics Heavy Business?
The same strategic framework used to evaluate the macro Peel vs. Calgary decision is equally applicable at a micro, intra-city level. A logistics-heavy business must constantly weigh the trade-offs between central proximity and suburban operational efficiency. The choice between a location in downtown Montreal and a larger facility in a suburb like Laval serves as a perfect illustration of this principle in an Eastern Canadian context.
A smaller, last-mile delivery hub in Montreal’s core offers unmatched proximity to the densest consumer and business populations. This can be ideal for courier services or quick-commerce operations where delivery time is measured in minutes, not hours. However, this access comes at the price of high real estate costs, severe traffic congestion, and zoning restrictions that limit truck size and operating hours. Conversely, a large-scale distribution center in Laval provides the space, lower land costs, and direct highway access necessary for bulk storage and regional fulfillment. The trade-off is the increased stem time and distance to the final delivery points in the city center.
To make this decision, one must conduct a granular comparative analysis, similar to how an operator in the GTA would evaluate competing sub-markets. The methodology involves weighing factors like intermodal access, labor competition, land costs, and congestion. This is the same logic, applied on a different scale.
| Factor | Brampton (Central Peel) | Milton (Halton Region) |
|---|---|---|
| Intermodal Proximity | 5-10 km to CN/CP yards | 20-30 km to terminals |
| Labor Pool Size | Massive, highly competitive | Growing, less saturated |
| Land Costs | Premium ($15-20/sq ft) | Moderate ($10-15/sq ft) |
| Traffic Congestion | High during peak hours | Moderate, improving infrastructure |
| Future Expansion | Limited, mature market | High potential, developing area |
How to Staff Your Warehouse for the Holiday Rush vs. the January Slump?
Managing the extreme seasonality of Canadian retail is a defining challenge for any distribution center. The massive ramp-up for the November-December holiday peak, followed by the abrupt drop-off in January, can wreak havoc on labor budgets and operational stability. A successful staffing strategy is not reactive; it’s a proactive, year-long plan designed to build a flexible and scalable workforce. Relying solely on last-minute temp agency hires is a recipe for high costs, poor training, and inconsistent performance during your most critical sales period.
A more sophisticated approach involves building a multi-layered talent pipeline. According to insights from leading experts at Supply Chain Canada, best practices involve early and strategic engagement with local talent sources. One of the most effective strategies is to partner with local colleges and technical institutes that offer supply chain and logistics programs, such as Sheridan and Humber in the GTA or SAIT in Calgary. Engaging these institutions months in advance of peak season—ideally in September for the holiday rush—allows you to tap into co-op programs and a pipeline of motivated students.
Furthermore, slow periods like January and February should not be seen as downtime, but as a strategic opportunity for cross-training your core staff. Building a flexible workforce where employees can perform multiple roles (e.g., picking, packing, receiving) creates immense operational resilience. When demand surges, you can redeploy personnel to bottlenecks without having to hire and train new external staff. Finally, for the portion of the workforce that must be temporary, negotiating retainer agreements with agencies well in advance (e.g., by July) can secure better rates and a higher quality of worker. Tying this to retention bonuses for seasonal workers who complete the entire peak period is a critical tactic to reduce mid-season attrition.
Key Takeaways
- Embrace the Dual-Hub Model: Stop thinking “either/or.” The optimal Canadian strategy uses Peel for eastern density and Calgary for western reach in a single, networked system.
- Focus on Total Cost-to-Serve: Move beyond rent and labor rates. Analyze the all-in cost, including drayage, congestion delays, and insurance, to find your true bottom line.
- Use Geographic Arbitrage: Leverage Calgary’s lower operational friction (terminals, labor) to offset Peel’s higher costs, creating a balanced and resilient national network.
Multi-Modal Transportation in Canada: How to Reduce Shipping Costs by 20%?
The ultimate goal of a well-architected distribution network is to enable a cost-effective, multi-modal transportation strategy. For a country with Canada’s vast distances, relying exclusively on over-the-road trucking is financially unsustainable. The “Peel and Calgary” dual-hub model is the key that unlocks significant multi-modal efficiencies, allowing you to use the right mode for the right distance: rail for the long-haul, and trucks for the final mile.
In this network, full truckloads or containers are moved via cost-effective and fuel-efficient rail between your eastern and western hubs. This cross-country portion is the most expensive leg of the journey. By consolidating freight and using intermodal rail, you drastically reduce your cost per kilometer. The distribution centers in Peel and Calgary then act as the staging grounds for final-mile and regional delivery via truck. This strategy has been proven to deliver substantial savings, with some operators like McKenna Logistics reporting a 20% reduction in shipping costs by implementing such a Canada-based logistics network.
Case Study in Practice: NFI’s Integrated National Network
NFI Industries provides a powerful real-world example of the “Peel AND Calgary” strategy in action. Through strategic acquisitions, first of Dominion Warehousing and later SDR Distribution, NFI doubled its Canadian footprint to create a truly integrated national network. This system is designed for omnichannel fulfillment, seamlessly connecting bulk transfers between hubs with direct-to-store and direct-to-consumer e-commerce deliveries. Their presence in both Eastern and Western Canada allows them to optimize market coverage while using their network to systematically reduce last-mile costs, demonstrating the power of a multi-location, multi-modal approach.
By positioning your facilities as key nodes in this rail-and-road network, you are not just choosing a location; you are designing a more resilient, cost-effective, and environmentally sustainable supply chain. The decision between Peel and Calgary becomes less about a single winner and more about how these two powerful hubs can work in concert to serve the entire Canadian market efficiently.
To effectively serve the entire Canadian market, the next step is not to choose a city, but to architect your optimal distribution network. Begin by modeling your specific cost-to-serve across a dual-hub framework to identify the precise balance of cost, speed, and resilience your business requires.